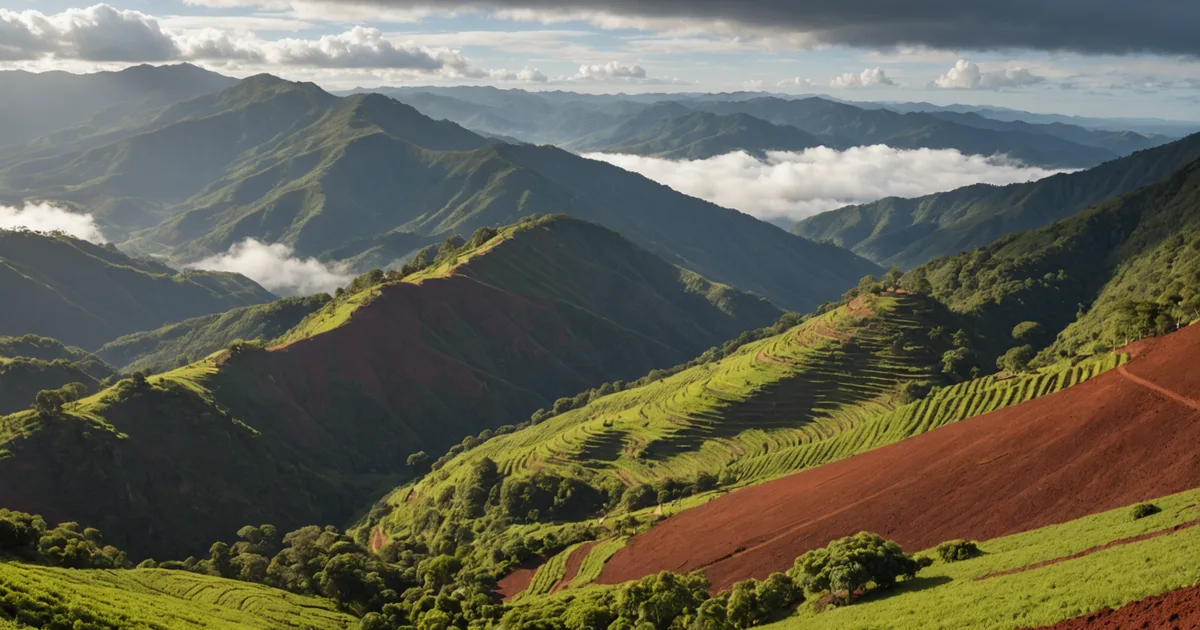
An arabica plot at 1,100 meters above sea level in Sul de Minas produces specialty-grade beans at about three times the rate of plots below 700 meters in lowland cerrado areas. This is more than a quality distinction. At cooperative weigh-in, it creates a 30 to 50 percent price-per-bag difference, generating the cash flow a grower needs to service a loan.
To build a credit model for Brazilian coffee smallholders, we began with one question: which observable, verifiable plot variables in the Sul de Minas growing region best predict repayment capacity? We tested altitude, soil classification, and yield history consistency as the main inputs. After calibration against production data from our early-access pilot cohort, these three variables represent the substantial majority of the production risk signal we can obtain from publicly available sources.
Below is what each variable indicates and why it matters.
Altitude: Price Indicator and Yield Stability
Above 900 meters, coffee in the Minas Gerais highlands develops fruit in cooler conditions. Slower maturation creates denser beans with more sucrose, leading to stronger cup scores. Sul de Minas cooperatives pay per-bag premiums for certified specialty-grade and high-grade commercial lots. These premiums are steady and shaped by the market, rather than being discretionary.
In the credit model, altitude above a threshold serves as a dependable proxy for the price-premium share of grower revenue. A grower who regularly sells specialty-grade lots to a cooperative in the Sul de Minas appellation receives more than commodity pricing, directly strengthening the debt service coverage ratio for a harvest-aligned loan. The altitude to price-premium link is observable in cooperative weigh-in data across multiple seasons, not a speculation.
Altitude is also negatively associated with some disease-pressure patterns. Coffee leaf rust (Hemileia vastatrix) spreads more readily in warm, humid lowland settings. In most years, higher-altitude plots face less severe rust pressure, lowering the chance of catastrophic yield loss within a season. This is not universal, and unusual weather has brought rust to high-altitude plots in certain years, but the direction of the relationship is consistent enough to include in the model.
We obtain altitude as a fixed input from NASA's SRTM digital elevation model. After a grower's GPS plot boundary is drawn in our application portal, the system automatically returns a mean altitude value. Manual verification is unnecessary, and the value stays the same between lending cycles.
Soil Type: Organic Matter, Drainage, and Yield Floor
Soil classification provides a different signal than altitude. Brazil's national EMBRAPA soil survey maps agricultural soils at scales suitable for regional analysis. For coffee, the key distinction is between deep, well-drained latosols with sufficient organic content and shallower soils that retain less water.
Latosol vermelho (red oxisol) and latosol vermelho-amarelo (red-yellow oxisol) are prevalent across the Sul de Minas growing regions. With sufficient organic matter inputs, these soils support deep roots and hold moisture through dry-season stress. A coffee plant in well-structured latosol containing 4 to 6 percent organic matter can produce more consistently over the biennial bearing cycle, with less yield variation than the same variety in a shallow or eroded soil profile.
For credit assessment, soil type mainly adjusts yield stability rather than predicting yield level. Two plots with comparable altitude and management intensity may reach similar peak yields in favorable years yet have substantially different yield floors during drought or after frost. Water retention capacity partly sets that floor. A grower on latosol vermelho-amarelo has more protection in a difficult season than one on shallow Cambissolo with low organic matter.
We obtain soil classification from EMBRAPA's national survey polygons and match them to the GPS plot boundary at parcel level. This input has a coarse resolution of roughly 1:250,000 and cannot show soil variation within a plot. We use it as a directional adjustment to the composite score, not as a precise description of soil conditions for each square meter.
Yield History: Consistency Over Magnitude
The third variable most directly indicates debt service capacity: what did the grower deliver to the cooperative over the previous two to four seasons, and how steady were those deliveries?
Minas Gerais coffee production follows a biennial bearing pattern. High and low harvests alternate in even-year and odd-year cycles as plants move between heavy fruiting and recovery years. A grower delivering 15 bags per hectare in a high year and 8 bags per hectare in a low year has a different risk profile from one delivering 10 bags in the high year and 3 bags in the low year, even when their multi-year averages are alike. The floor yield sets minimum cash flow, so the repayment schedule should be based on the floor rather than the average.
When growers authorize the request, cooperative delivery records provide three to five seasons of per-hectare yield figures. We ask applicants to approve this data request during the application. For growers outside cooperatives or selling to multiple buyers, we use satellite NDVI trends as a yield proxy, although this introduces more model uncertainty than verified delivery records.
Stability is as important as average delivery. A grower with moderate, steady yields over four seasons receives a more favorable score for this variable than one with high yields in two seasons and missing or low data in two others. Missing seasons may reflect crop failure, disease, or gaps caused by informal sales channels. Until more information is available, the model handles all three possibilities conservatively.
How the Three Signals Combine
The scoring model combines altitude, soil type, and yield consistency into a composite production risk score from 1-to-100. Higher scores indicate lower production risk. The three variables do not receive equal weights in every case. Altitude has greater relative weight for plots in the Sul de Minas designated origin zone, where the altitude to price-premium link is strongest and most direct. Yield consistency receives more weight when verified cooperative records cover three or more seasons.
Under our current calibration, a plot at 1,050 meters on red-yellow latosol with three consecutive seasons of verified cooperative deliveries above 12 bags per hectare scores in the 70-to-85 range. A plot at 680 meters on shallow soil with only one season of available yield data scores in the 40-to-55 range. These thresholds are calibrated against production data from our early-access pilot cohort in Sul de Minas, and we keep recalibrating as further application and repayment outcome data becomes available.
At this time, scores below 40 lead to a declined application. Scores from 40 to 65 lead to conditional approval for a reduced loan amount, with terms designed for expected production variation. Scores above 65 are approved for the requested amount, pending other eligibility checks, including land tenure confirmation and no active legal judgments.
The Model's Limits
We do not claim that this three-variable model includes every material credit risk faced by a smallholder coffee farm. It does not, and we believe that limitation should be stated clearly.
International coffee price risk is excluded from the model. A grower who pre-sold a harvest at low cooperative prices may face cash flow pressure regardless of their NDVI result or altitude score. We partly address this with harvest-aligned repayment structures that allow growers to match harvest cash flow to loan service, but price risk remains outside the production risk score.
Management quality is reflected in part through yield consistency and NDVI time-series patterns, but it is not fully measured. Two plots with the same altitude, soil classification, and past yields may perform differently because of pruning timing, fertilization schedules, and pest management choices. A well-managed plot on average soil can outperform a neglected plot on superior soil. The model treats yield history as a partial management signal, but that signal is indirect.
Production data does not show land tenure risk. An applicant facing a boundary dispute or an unregistered occupation situation would not reveal that risk through an NDVI reading or cooperative delivery record. Applicants must confirm land tenure status during the application, but here we depend on self-declaration rather than automated verification.
These limits make the model most useful as a structured primary input for a credit decision, alongside credit team review for applications in the intermediate scoring band and for applications that trigger specific flags. Examples include an unusual NDVI event in the prior season or an altitude-to-yield relationship that differs from the regional pattern.