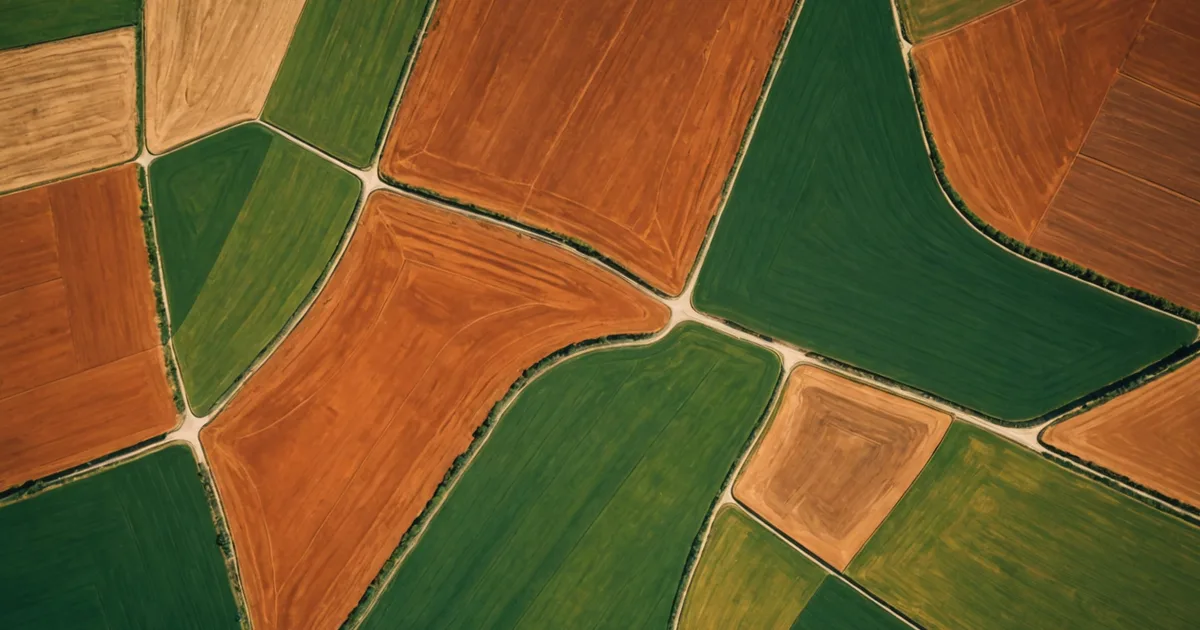
ESA's Sentinel-2 constellation revisits each point in Minas Gerais every five days at 10-metre resolution. This imagery is free, publicly archived, and includes wavelength bands that expose canopy stress, soil moisture, and crop vigor beyond what a standard RGB photo can show. We began applying it to agricultural credit decisions because its quality fit our needs: frequent, objective, plot-level monitoring with no marginal acquisition cost.
What NDVI Measures in Practice
The Normalized Difference Vegetation Index uses two Sentinel-2 spectral bands: near-infrared (Band 8) and red (Band 4). Its formula is (NIR - Red) / (NIR + Red). Dense, healthy green plants reflect near-infrared strongly and absorb red strongly. Sparse, stressed, or dead vegetation behaves in the opposite way. The resulting dimensionless score ranges from -1 to +1. In coffee-suitable conditions, readings above 0.4 generally show active growth, readings around 0.2-0.4 point to sparse cover or early stress, and readings below 0.2 suggest bare soil, severe stress, or a surface without vegetation.
On a coffee farm in the Sul de Minas altitude belt, a healthy Coffea arabica stand with full canopy generally records NDVI between 0.55 and 0.70 during the vegetative growth period, from October through February in the Southern Hemisphere growing calendar. A marked decline below that baseline during the growing season, when no harvest event explains it, deserves investigation. Possible causes include drought stress, a serious pest or disease outbreak, such as coffee leaf rust or coffee borer, the two main culprits in Minas Gerais, or mechanical damage.
How NDVI Time Series Enter a Credit Model
One NDVI observation taken when a loan application is submitted tells us little. Coffee canopy varies during the season. A multi-year series tied to the specific plot polygon is more informative because it can be compared with that plot's historical baseline and with nearby plots facing similar growing conditions.
We begin by extracting NDVI time series across the applicant's complete plot boundary. The source is Sentinel-2 L2A imagery, meaning surface reflectance products that have been atmospherically corrected, from the Copernicus Data Space archive, where records extend back to 2017. For properties in Sul de Minas, this provides about seven to eight complete growing seasons of plot-level canopy history.
We derive three main scoring signals from the series. The first is mean peak NDVI over the latest two growing seasons, the strongest individual correlate of canopy density and, consequently, expected production volume. The second is the NDVI coefficient of variation over that same period, which shows year-to-year canopy consistency and serves as a proxy for weather exposure and management quality. The third is the difference from the regional peer mean, adjusting for the biennial bearing cycle and for the naturally lower NDVI found in cerrado altitude zones than in the higher-altitude Sul de Minas belt.
Cloud Cover and Practical Limits
Minas Gerais experiences a marked rainy season from November through March, overlapping coffee's peak vegetative growth period. Cloud cover is considerable during these months. If we simply depend on one Sentinel-2 pass, a plot will often return imagery with 80 percent cloud masking.
We address this through compositing. A five-day revisit cycle gives us six or more acquisition opportunities each month. Over a two-month window, we generally collect enough cloud-free or low-cloud pixels for a given plot to build a usable composite. We calculate the median NDVI from all valid, cloud-free pixels in the window, weighting the result by the cloud-free proportion. For plots under 2 hectares in sub-regions with persistent cloud, the method sometimes fails. In those cases, we use the prior season's composite and apply a confidence downgrade to the risk score.
This technology has a genuine limitation, and we state it plainly. When satellite quality is inadequate, the credit model places greater weight on cooperative yield records and soil classification data, while widening the risk score's confidence band. The lender receives a data-quality flag showing which signals were strong and which were imputed.
What Satellite Imagery Does Not Show
NDVI indicates canopy health, not production history. A plot may have excellent NDVI yet produce less because of processing choices, such as picking cherries at the wrong ripeness stage, harvest labor shortages, or logistical problems moving cherries to the pulper. The reverse can also occur: a plot may have moderate NDVI because its shade-growing method intentionally limits canopy density while producing exceptional cup-quality beans that command premium prices.
We do not claim that remote sensing replaces agronomic visits or cooperative yield records. Satellite observations are one input among several in a multi-signal model. Their advantage is objective, consistent coverage for any plot with a known GPS boundary, even when the grower lacks formal financial records. This creates an initial evidence layer for growers who might otherwise remain outside conventional underwriting.
We also avoid penalizing growers shifting to organic production or agroforestry, whose NDVI patterns may differ from those of monoculture coffee stands. The model includes a cultivation-method flag drawn from the grower's application, and the NDVI interpretation parameters change accordingly. Lower NDVI on an agroforestry plot containing shade trees does not carry the same meaning as lower NDVI on a monoculture plot experiencing drought stress.
How It Fits the Complete Risk Signal Stack
Within our scoring pipeline, Sentinel-2 NDVI contributes to the production-potential portion of the risk score. Other principal inputs include altitude and microclimate classification, drawn from SRTM digital elevation data and INMET weather station records, soil organic matter and texture from EMBRAPA's SolosWeb database, and yield history from cooperative records when available or from grower-submitted harvest receipts.
Signal weights change according to farm type and available data. For a 12-hectare Sul de Minas farm with five years of cooperative delivery records, yield history receives the greatest weight because it most directly observes production capacity. NDVI then provides a near-real-time check on whether the farm's physical condition matches that past yield. For a first-time applicant without cooperative records, NDVI receives greater weight because it is the only objective evidence of production condition available.
Why Public Data Sources Matter
Commercial providers sell imagery with higher resolution and more spectral bands. We make Sentinel-2 our main remote sensing source because it is free, openly licensed, and broadly validated for agricultural monitoring. The European Space Agency's Copernicus program publishes extensive material on data quality, calibration methods, and validation studies across agricultural uses worldwide.
An open, auditable source also supports transparency with growers and lending partners. If a grower asks why the NDVI score was lower than expected, we can identify the relevant Sentinel-2 acquisition date and band readings. No proprietary vendor score sits between the evidence and the decision. Anyone who wishes to check the result can access the underlying data.
That openness is important to maintain. Agricultural credit decisions influence people's livelihoods. Growers should be able to understand the evidence behind their risk score, while lenders must be able to audit the data chain supporting the decisions they make. Public satellite imagery meets both needs in a way proprietary data pipelines cannot.